


UC3D230-90×80-B/R 3D Line Laser Profilometry Sensor Camera
Introduction
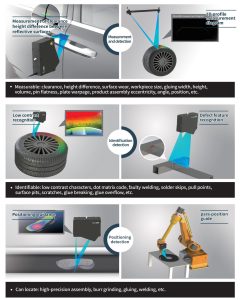
High-definition and high-speed industrial cameras are selected as the core components, and the software and hardware are independently designed and developed, bringing many competitive advantages such as low-cost and customizable for system integration.
Details
Overview
Packaging & Delivery
Packaging Details:Strong Carton with Polyfoam Protection
Port:Beijing
Lead Time:Within 1-2 Weeks after Receiving Payment
Introduction
Introduction
High-definition and high-speed industrial cameras are selected as the core components, and the software and hardware are independently designed and developed, bringing many competitive advantages such as low-cost and customizable for system integration.
Feature
1.Stable and reliable
2.High precision and high speed
3.Professional customization
4.2D Pain Spot, 3D to Solve
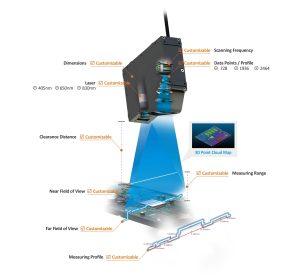
Specification
|
Model |
UC3D40-40×25-B/R |
UC3D230-90×80-B/R |
UC3D230-811×260-R |
UC3D230ED-800×600-R |
UC3D500-158×400-B/R |
UC3D500-165×140-B/R |
|
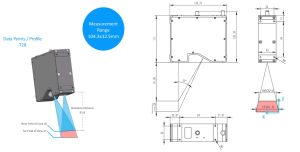
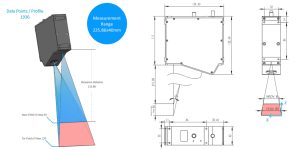
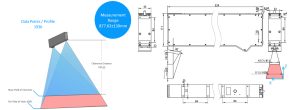
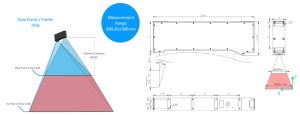
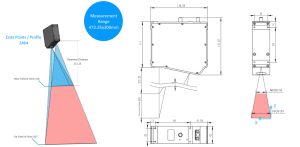
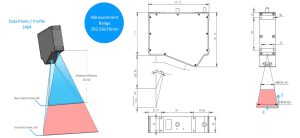
Data Points/Profile |
728 |
1936 |
1936 |
1936 |
2464 |
2464 |
|
Clearance Distance (mm)① |
91.8 |
215.86 |
747.63 |
589.81 |
272.25 |
222.56 |
|
Measuring Range Z (mm) |
25 |
80 |
260 |
600 |
400 |
140 |
|
Near Field of View X (mm) |
40 |
90 |
811 |
800 |
158 |
165 |
|
Far Field of View X (mm) |
47 |
120 |
1000 |
1500 |
367 |
260 |
|
Repeatability Z (μm)② |
3 |
3 |
18 |
18 |
7 |
3 |
|
Resolution Z (mm)③ |
0.010 |
0.0175 |
0.1 |
0.35 |
0.08 |
0.025 |
|
Resolution X (mm)③ |
0.055-0.065 |
0.062 |
0.419-0.517 |
0.413-0.775 |
0.064-0.15 |
0.1 |
|
Laser (nm) |
405(B)/ 650(R)/ 830(IR) Optional |
|||||
|
Laser Class |
3B |
|||||
|
Scan Rate (Hz)④ |
1335-6786 |
450-1968 |
700-1968 |
530-4576 |
200-3500 |
290-3430 |
|
Data Interface |
USB3.0 (3m drag chain cable straight out/ 5-30m optical fiber cable optional) |
|||||
|
IO Interface |
2 inputs (1 contour triggered encoder differential/ 2 optocoupler isolation is optional and dedicated, 1 start/ end sensor bidirectional optocoupler isolation dedicated) |
|||||
|
Power Supply |
5V@900mA (USB3.0 Direct Supply) |
|||||
|
Operating Power Consumption |
480mA@5V |
465mA@5V |
536mA@5V |
536mA@5V |
465mA@5V |
480mA@5V |
|
Dimensions (mm) |
134.74*42*111 |
134.4*42*111 |
524*43*111 |
359.96*43*111 |
136.58*42*111 |
157.13*42*111 |
|
Degree of Protection |
IP65 |
|||||
|
Housing Type |
Aluminum alloy |
|||||
|
Operating Temperature/ Storage Temperature |
0~+45°C (no freezing)/-30~+70°C |
|||||
|
Operating Humidity |
35%~85%RH without condensation |
|||||
|
Weight (g) |
900 |
911 |
2000 |
2000 |
947 |
1020 |
|
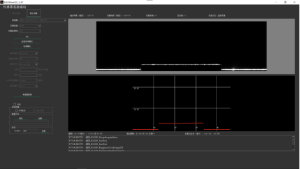
Scanning Software |
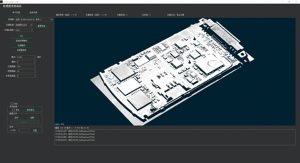
Support Windows, Linux and Arm Linux operating systems. Support the secondary development of common programming language such as C/C++/C#. Support profile, Zmap and 3D Point Cloud data acquisition. Support Halcon and PCL data formats, and provide complete sample source programs. |
|||||
|
Factory Calibration |
Yes |
|||||
1.The distance from the lower surface of the laser side of the shell to the near end visual field plane.
2.Measure the height of the plane of the standard gauge block at the middle of the measuring range, 3 times the standard deviation of 4096 measurement results.
3.The theoretical calculation value and the actual value shall be subject to the user’s actual measurement.
4.The scanning speed depends on the settings of the field of view, measurementrange and exposure time. The scanning in the maximum measurement range and minimum measurement range under the full field of view and minimum exposure time settings.
*The data involved in the product may vary due to environmental factors, and the company will not bear the consequences arising therefrom.
Professional Customization
Outline Drawing
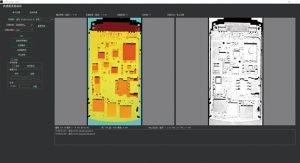
Depth & Brightness Map
3D Point Cloud Map
Dimension
UC3D40-40×25-B/R
UC3D230-90×80-B/R
UC3D230-811×260-R
UC3D230ED-800×600-R
UC3D500-158×400-B/R
UC3D500-165×140-B/R
Accessories
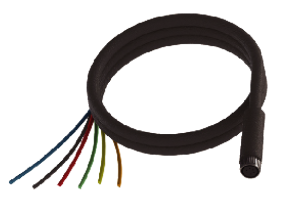
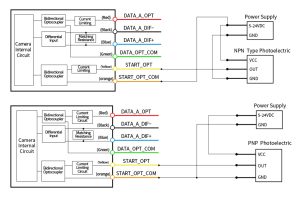
M8-6pin connecting cable (IO signal)
IO Signal Description
|
Linear Order |
Cable Color |
Name |
Trigger Frequency |
Explain |
|
1 |
Red |
DTA_A_OPT |
<1MHz |
Contour triggered encoder phase A, two-way optocoupler isolated input positive/negative |
|
2 |
Black |
DATA_A_DIF- |
Contour trigger encoder phase A, differential input cathode |
|
|
3 |
Blue |
DATA_A_DIF+ |
Profile trigger encoder phase A, differential input positive pole |
|
|
4 |
Green |
DATA_OPT_COM |
Contour trigger encoder input, two-way optocoupler isolation common terminal |
|
|
5 |
Yellow |
START_OPT |
<10KHz |
Start and end sensor signal input, two-way optocoupler isolation input positive/negative |
|
6 |
Orange |
START_OPT_COM |
Start and end sensor signal input, two-way optocoupler isolation common terminal |
|
|
— |
— |
Shield |
— |
Shield ground, connected to equipment shell ground |
External Wiring Diagram
Contour trigger
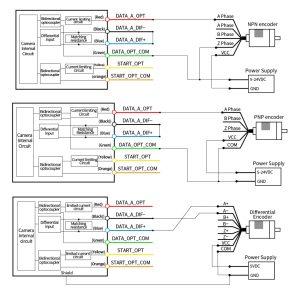
Start and end triggering
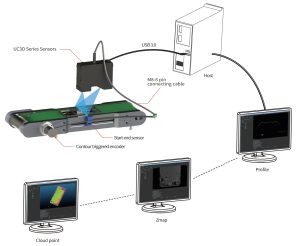
System Composition Diagram
")